Step Debugging with Xdebug
Imagine pressing pause on your program at the exact line you are curious about, then reading every variable as it stood at that instant. That is what Xdebug gives you.
Xdebug is not a separate program, and not a function you call the way you call var_dump(). It is a PHP extension: once installed, it changes how PHP itself behaves. That means a little more setup than the previous section needed, in exchange for the one thing print debugging cannot do: looking at everything in scope without having guessed in advance what to print.
Installing it
Xdebug is not bundled with PHP, so it needs installing separately. The generic way is through PECL:
$ pecl install xdebug
Most package managers offer it too (apt install php-xdebug on Debian and Ubuntu, brew install php followed by pecl install xdebug on macOS with Homebrew’s PHP). Whichever route you take, it then needs to be switched on in php.ini with a line resembling:
zend_extension=xdebug
Confirm it loaded:
$ php -v
PHP 8.3.0 (cli) (built: ...)
    with Xdebug v3.3.0, Copyright (c) 2002-2024, by Derick Rethans
If Xdebug’s name shows up there, it is active.
xdebug.mode: turning on what you need
Xdebug does several unrelated jobs, and a single setting, xdebug.mode, says which ones are switched on. It takes a comma-separated list in php.ini:
xdebug.mode=develop,debug
develop is worth leaving on all the time. It needs no other tooling and quietly improves output you already produce: var_dump() prints with color and tells you the file and line it was called from, and an uncaught exception comes with a full stack trace, arguments included, instead of PHP’s terser default. debug is the mode this section is about: it lets an external tool pause execution and inspect it.
Connecting an editor
Step debugging needs two ends talking to each other. On one end, PHP runs your script. On the other, an editor listens for PHP to say “I have paused, come and look.” PhpStorm and VS Code (with the “PHP Debug” extension) both do this out of the box, over a protocol called DBGp, on port 9003 by default.
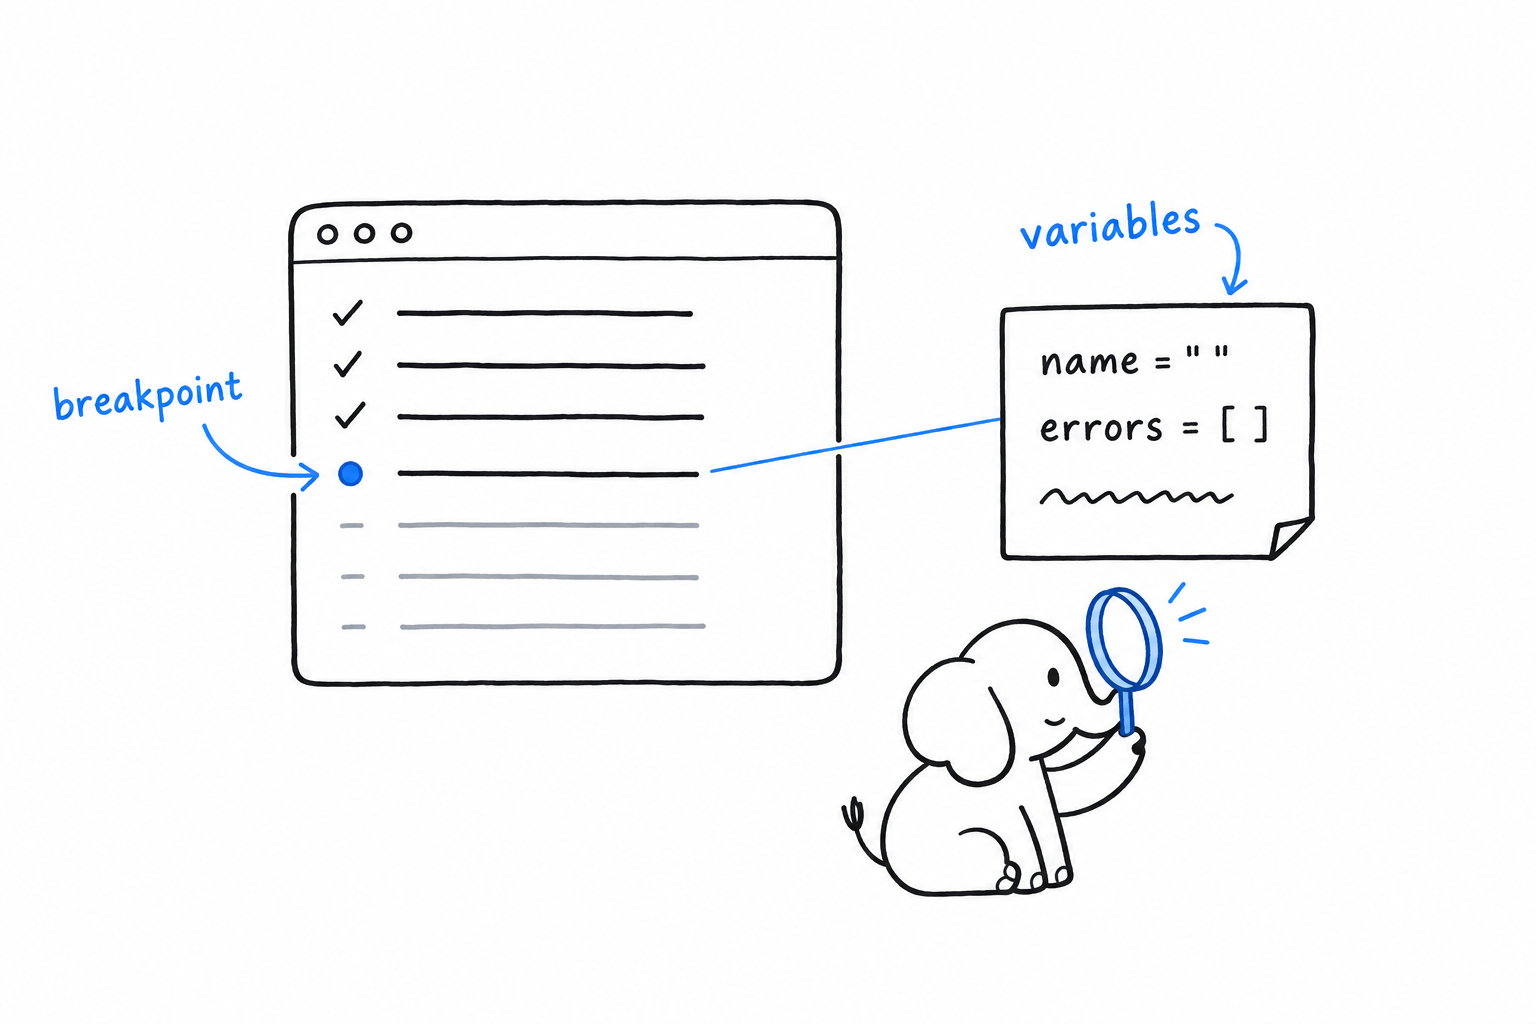
The setup has the same shape in either editor. You tell it to start listening for Xdebug connections. You click in the margin next to a line of code, and a red dot appears: a breakpoint, which means “pause here.” Then you run the script, from the terminal with php your_script.php or by reloading a page served by php -S, with xdebug.mode including debug. Execution stops the moment it reaches that line, before running it, and the editor shows every variable in scope at that exact point.
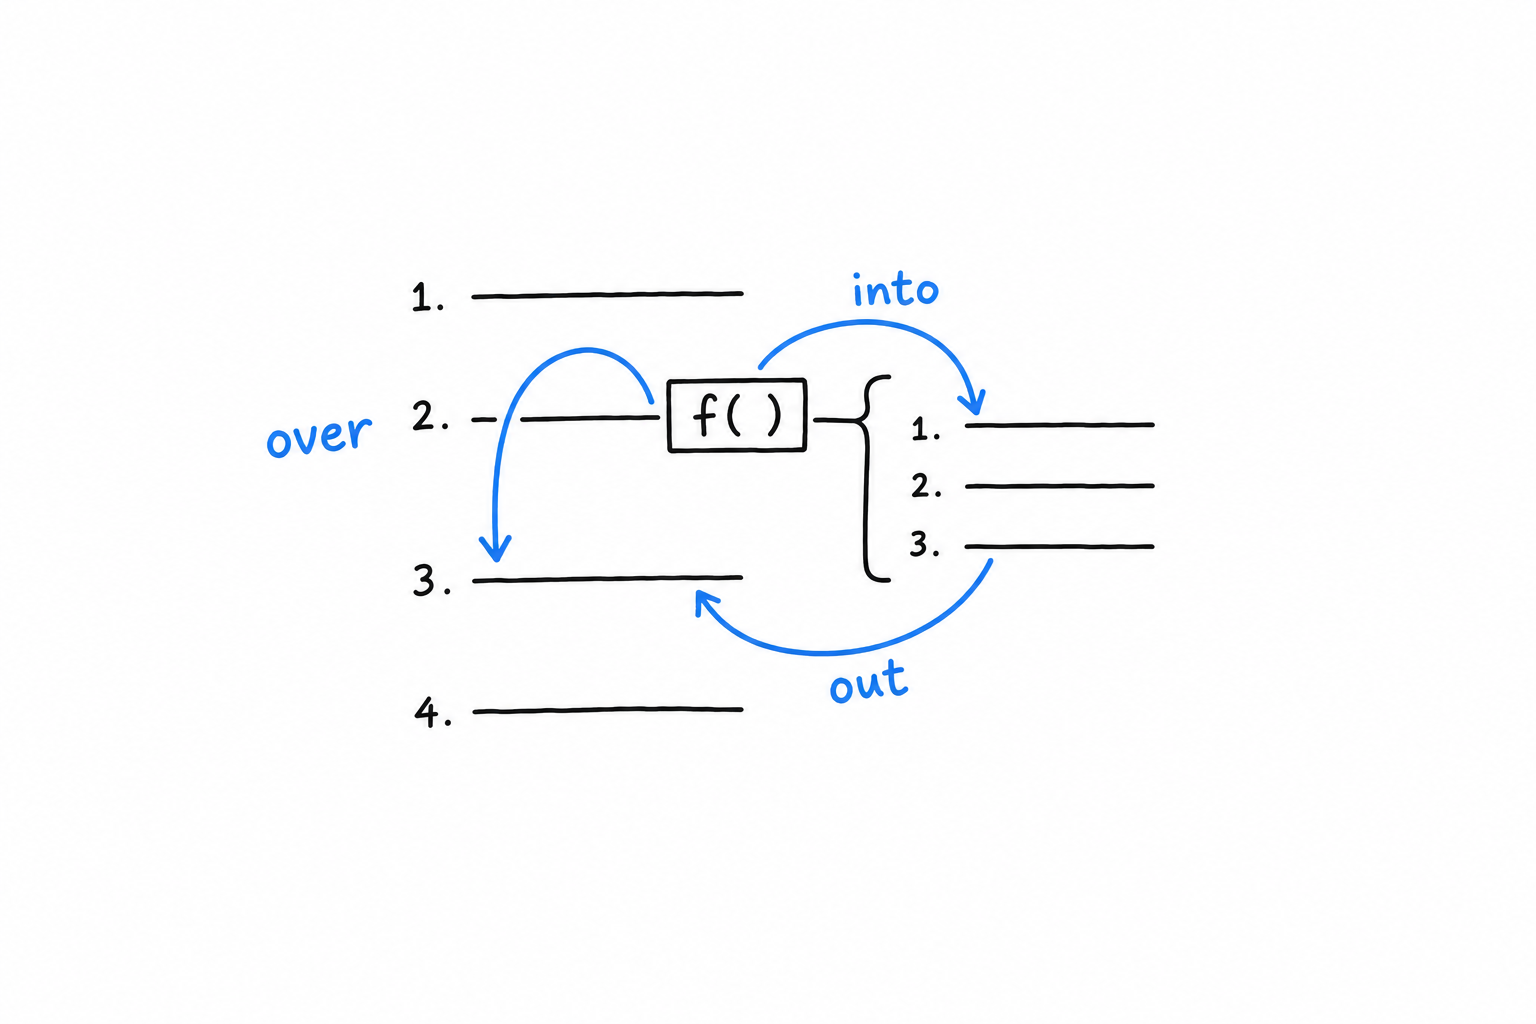
From there you have three ways to move. Step over a line runs it and stops at the next one. Step into a function call follows execution inside the function instead of running it as a block. Step out finishes the current function and stops back in its caller. Variables update in the panel as you go.
Trying it on the guestbook
The validation code from Chapter 10 is a good place to practice: small enough to hold in your head, with a real branch worth watching.
if ($name === '') {
    $errors[] = 'Name cannot be empty.';
} elseif (mb_strlen($name) > 60) {
    $errors[] = 'Name is too long.';
}
Set a breakpoint on the if ($name === '') line. Start the built-in server with xdebug.mode=debug set, start listening in your editor, and submit the guestbook form with the name field left blank. Execution pauses right there. The variables pane shows $name as an empty string and $errors as an empty array, exactly as they stood at that instant, before a single line of the if block has run. Step over it, and watch $errors gain its first entry.
No
var_dump()had to be written, moved, or removed to see any of that. That is the entire value of step debugging.
Profiling, briefly
xdebug.mode=profile turns on a third capability. Instead of pausing execution, Xdebug records how long each function call took and writes the result to a “cachegrind” file (xdebug.output_dir says where). Tools like QCachegrind, or the profiler built into PhpStorm, read that file and show you exactly where a slow request spent its time: which function, called how many times, for what share of the total. Chasing slowness is a different job from chasing a wrong answer, closer to what Chapter 15 discusses about loops and generators, but it is the same extension, and worth knowing about.
Choosing between the two tools
Honestly, reach for var_dump() and print_r() first. They need no setup, and for most bugs, especially early on, printing the value and looking at it finds the problem in seconds.
Reach for Xdebug once printing stops narrowing things down: when a bug depends on a sequence of calls rather than a single value, or when you catch yourself adding and removing var_dump() for the third time on the same problem. At that point, pausing the program and looking around costs less than guessing again.